Get to Know the New DDE Overview
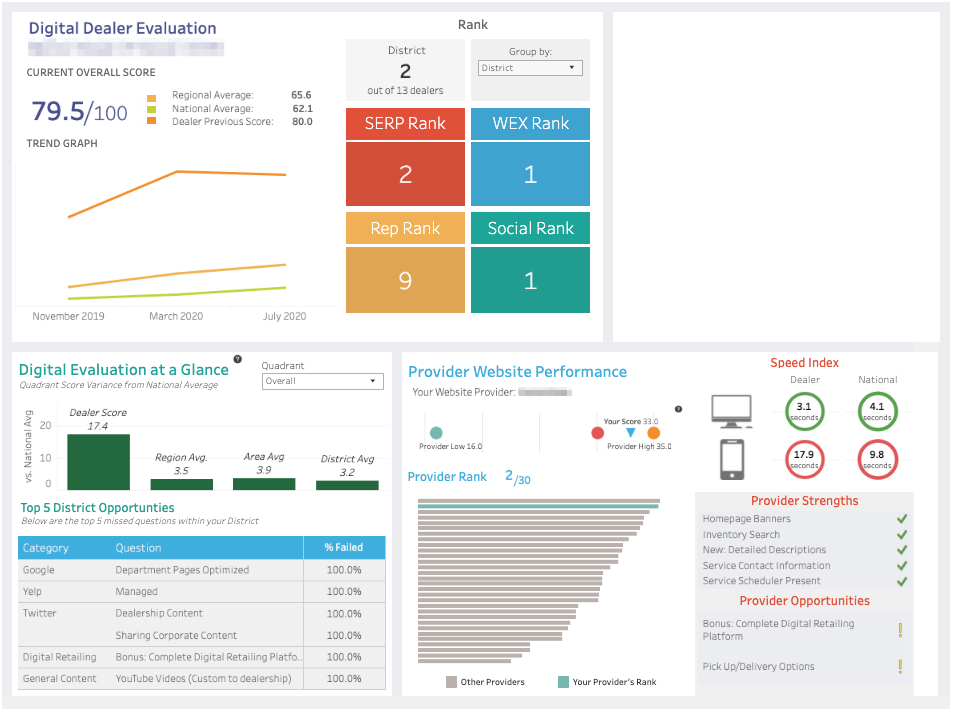
In an effort to continue the improve the tools and consumer experience insights dealers have access to as part of the Dealer Digital Evaluation (DDE) program, the Nissan Digital Customer Experience team and our partners have worked to update the Overview page of of the DDE with brand new visuals and analytics. Below you will find descriptions and explanations of the latest enhancements. We look forward to you being able to put this information to work for you!
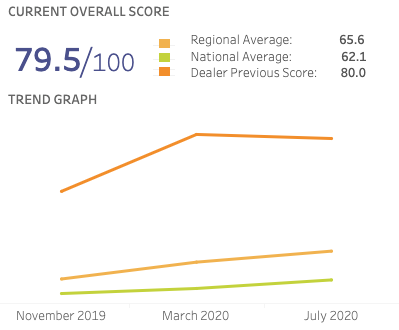
DDE Trends
The first chart should be a familiar one. The period over period trends it shows have been present since you began to receive the DDE nearly 2 years ago. This line chart will give you a time based comparison of your dealership's performance, versus the national and regional average.
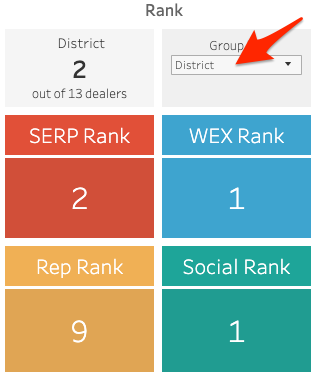
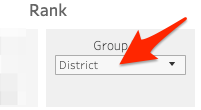
Rankings by Quadrant
A new comparison tool, the Rankings grid allows you to see where your dealership ranks, both by overall score and quadrant score, within your district, area, region, and the nation. Simply use the drop down selector to toggle between the grouping you would like to view.
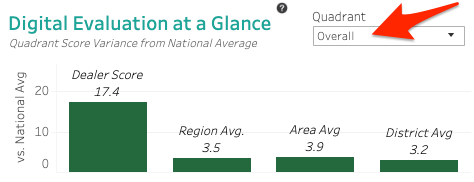
Digital Evaluation at a Glance - Variance from the National Average
Another new insight, this chart is intended to give you visibility into how much your dealership, district, area, and region scores vary from the national average. The "zero point" of the y axis serves as the national average for the current period. Each bar represents your dealership or a group that your dealership is a part of (district, area, region). If the bar is above the line and green, that cohort is performing above the national average. If it's below the line and red, that cohort is performing below the average. How points off the average is indicated on each bar.
By default, this chart will show you the variance for the overall average. However, if you're interested in drilling further, you can choose individual quadrants to view by using the drop down selector.
Top Opportunities
We often get asked about the most common items that the DDE identifies as areas of opportunities. We're making that information more readily available in this table. Here, you will be able to see the top 5, most missed criteria across the district your dealership is a part of.

Tip: If you would like to expand the scope, you can change the grouping view by using the same group selector from the Ranking Chart section of the dashboard.
Enhanced Provider Performance Insights
As a part of the DDE analysis, we cross reference the data gathered from the Website Experience section of the evaluation with the providers that dealerships use for their website. In doing so, we're able to compare how each provider performs. We've expanded on this dashboard area to provide even greater levels of insight.
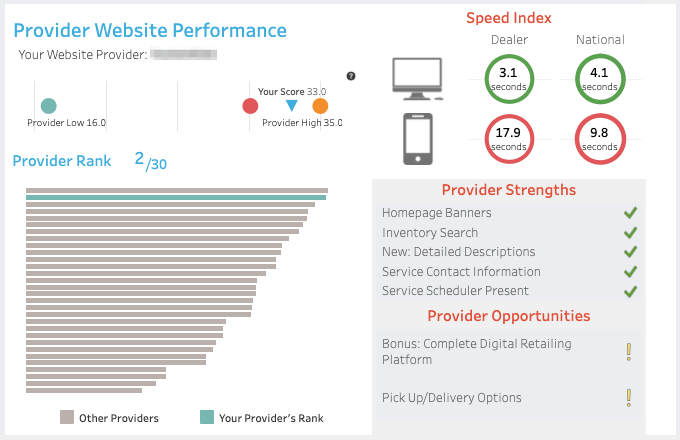
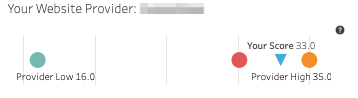
Provider Score Spread
First, we share the high, low, and average Website Experience score for your provider as compared to your dealership's score. Providers work with a variety of dealerships, and as such, it's expected that there would be a range of scores for one provider. This gives you a snapshot of how your website stacks up among others that your provider supports.
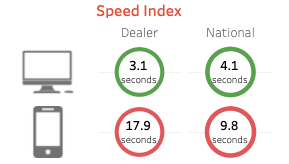
Page Speed
While your website provider doesn't have complete control over the speed at which your page loads, They do influence it. As such, we've included insights into how your websites Page Speed Index stacks up to the national average for both desktop and mobile. The current evaluation threshold for Page Speed Index is 6 seconds. In this table, page speeds faster than 6 seconds will be indicated with a green circle. Anything longer than 6 seconds will show upo as a red circle.
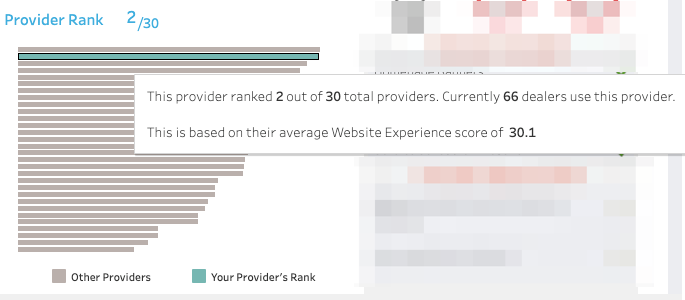
Provider Rank
You have choices when it comes to web provider. We want dealers to be educated when it comes to making that decision. While the ranking in this chart isn't necessarily an indicator of which provider is the best one for your dealership, it will show you, comparatively, where your provider ranks based on their average Website Experience score across all the websites they support. Hovering over each bar will also give some additional insights such as how many dealers a particular provider supports. This is important to consider as it may be easier for a provider to have a high average when they only support 10 stores. On the other hand, a provider who has a slightly lower average may be supporting 100+ dealers. These factors can all come into play when considering which provider you choose to work with.
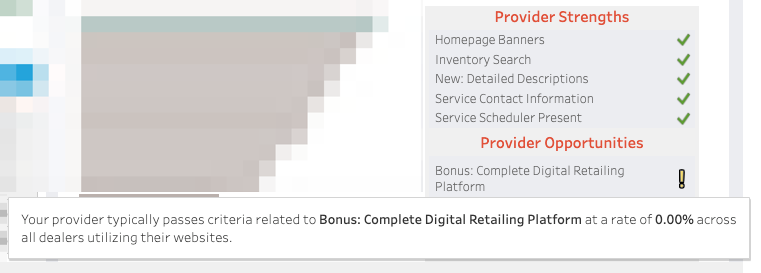
Strengths and Opportunities
Beyond just looking at a providers average, you may have questions about what your provider does really well and areas they may need to improve. The strengths section will highlight the top Website Experience criteria that your provider excels at based on pass rate across all the dealers they support. On the other side, we'll also indicate the criteria with the lowest pass rate in the opportunities section. Clicking the "i" icon next to one of these criteria will give more information as to what your providers specific pass rate is for that criteria.
Ready to put these tools to work? Head to NNAnet today to view the new dashboard, Once logged in, click on the "my Links" navigation, head to the Customer Experience section, and click the "Dealer Digital Evaluation" link,.